One minute please...
Introduction
This post will teach you how to allocate your marketing budget using the reports in Google Analytics. You'll learn how to setup campaign tracking and identify your best traffic sources. By the end you should know how to spend your marketing budget wisely.
Contents
- Start with an Overview
- Which Channels don’t get credit
- Path Length
- Interactions Length
- Links between Channels, ads, and keywords
- Cost of each Channel
- Segment Further
Overview
Google Analytics segments customers by their origin. We can use this data to adjust our marketing campaigns and move our budget to the best performing sources of paid traffic.
The reports allocate credit to channels (i.e. Organic Search, Referral, Email) in the conversion journey using an attribution model.
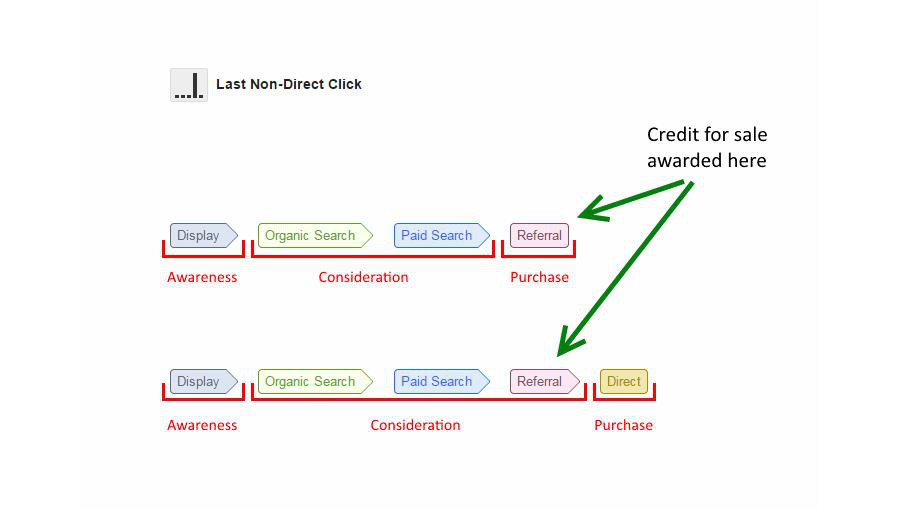
By default Google Analytics uses a Last Non-Direct attribution model.
-> The Last Non-Direct attribution model gives all the credit for a conversion to the last channel that the customer clicked through before converting.
-> If the customer came directly, and they have visited from another source in the last six months the conversion will be attributed to the previous traffic source instead.
1. The Last Non-Direct attribution model is very misleading.
2. It doesn’t give credit to the sources of traffic earlier in the funnel
3. It doesn't take into consideration the time it takes a customer to convert.
Try to compare the Last Interaction model to the Last Non-Direct model with the model comparison tool. You will probably find that your direct conversions go up significantly. This reveals a lot more of your conversions are finished following a direct visit than you probably thought.
Comparing the Last Non-Direct and Last Interaction model shows you how many of your conversions were completed by direct visits. A lot more of your conversions are probably tracked as Direct / (none) than you realised.
-> Imagine for a moment, you send an email to your mailing list with your current offers,
-> Some recipients will make a purchase,
-> Some will not,
-> Some may unsubscribe,
---> If you continue sending out emails to the same mailing list you are going to run out of potential customers.
Problem One: We need to increase the number of customers on the mailing list, these customer are entering the conversion funnel.
The Last Non-Direct attribution model will guide you to invest your marketing budget in the channels at the end of the funnel.
This is at a point where most customers have already decided to purchase.
Solution: We can use the reports in Google Analytics to work out which sources of traffic drove the newsletter signups.
We need to use an attribute model that gives credit to the channels earlier in the funnel.
These channels are assisting those at the end of the funnel.
Problem Two: We also need to consider how much it costs you to make a sale.
You may be getting lots of sales or leads.
If they start to drop you can buy more traffic.
However,if the Cost Per Acquisition (CPA) is to high you can start losing money even if you’re making sales.
Solution Two: We can upload the costs of all our marketing activity into Google Analytics. This means we can analyse the whole sales journey and alter our marketing budget accordingly.
Hypothesis
1. "I believe that before making a purchase my customers visit more than once via different channels."
2. "Optimising the channels that drive Last Click conversions is a mistake."
3. "I think that optimising the channels earlier in the purchase funnel will have a bigger impact on conversion rate."
Setup & Configuration
Identify your Objectives
I have a detailed blog post here about setting up a Google Analytics and defining your objectives.
You started your website or app with a objective in mind and you probably started advertising to increase the number of customers achieving your objective. For example;
1. Sign up to your website
2. Buy a products
3. Subscribe to a newsletter
4. Read a blog post
5. Complete an enquiry form
You could be starting social media campaigns or sending out newsletters. Perhaps you are running a competition or starting paid search ads. To measure the performance of these campaigns you must set up goals. Your Google Analytics Goals reflect your business objectives. You could measure success with clicks or sessions but many visitors leave without ever completing your objective.
"Goals let us measure how many customers actually complete our objective and not just landed on our homepage".
Build a Tagging Strategy
I have a detailed blog post here about setting up a Google Analytics Tagging Strategy.
You cannot track your marketing campaigns if you have not planned an tagging strategy. Campaign tagging tells Google Analytics where that customer has come from. Add Google Tracking parameters to the URL links in your campaigns using the Google URL Builder. When visitors arrive on your website Google Analytics tries to identify where that customer has come from. If you’re using Google AdWords or Bing Ads, link your account and enable auto tagging.
Define Your Channels
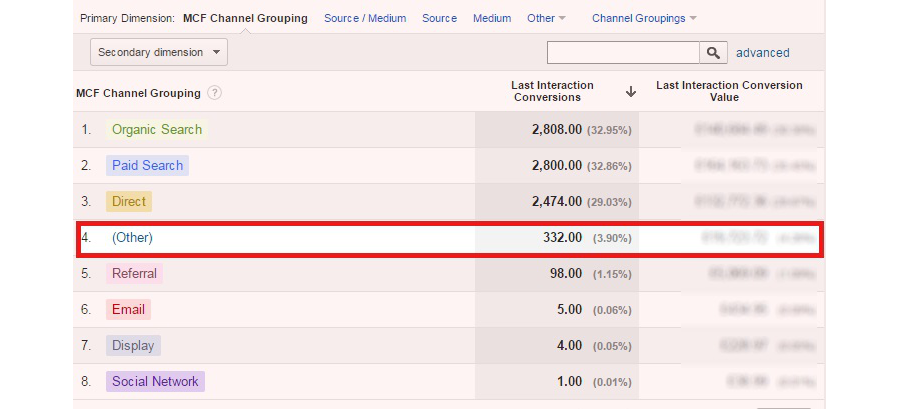
Channel grouping allows you to group, segment and analyse several types of traffic together. Google automatically groups most of your visits into the default channel grouping but it’s important to check the traffic is being attributed to the correct bucket.
If not tagged properly It’s common for organic traffic like duckduckgo to end up in your referral channel and email visits to end up in ‘Other’. Creating a new custom Channel group or adding additional channels like video or generic and branded keywords is very simple.
Read this blog to learn more about bidding on brand keywords.
Cost Upload
Sharing Google AdWords campaign data with Google Analytics is very easy and adds important context to the data. As well as AdWords, it’s also important to understand the performance of all your other campaigns in the same way.
If you’re running any other campaigns for instance email, AdWords, Facebook, Instagram or Twitter you need to compare conversion rates and ROI. The Cost Data Upload tool allows you to import data from non-AdWords paid campaigns so you can measure the performances within the Google Analytics.
The first step is to create a Custom Data Source in your Google Analytics account and then follow the instructions for the Google Analytics import tool to upload the data.
With cost data imported from AdWords and non-Google campaigns you can compare the performance against the cost to give you a real CPA.
Analysis
We can use the Multi-Channel Funnels reports to;
1. Work out how your Channels (i.e. Organic Search, Referral, Email) work together.
2. Find out how much time passed between a customer’s first interaction and the purchase.
3. How much revenue ($) assisting Channels make.
4. What value each Channel brings to your business.
Start With An Overview
1. Select an unfiltered view
- A filtered View can corrupt your user journeys.
2. Open Conversions tab
3. Multi-Channel Funnels
4. Overview.
5. Select a goal or ‘transaction’
6. This is your measurement stick.
1. Start your analysis with an overview
2. But don't analyse the goals in aggregate
- The time (i.e.Time Lag) and The number of interactions (i.e.Path Length) a customer needs to convert will vary for each goal
A customer considering a big purchase will need much more time than one signing up for a newsletter. Therefore your Path Length and Time Lag will be different for newsletter signup and a transaction.
1. Now select a date range
- I recommend at least 3 months
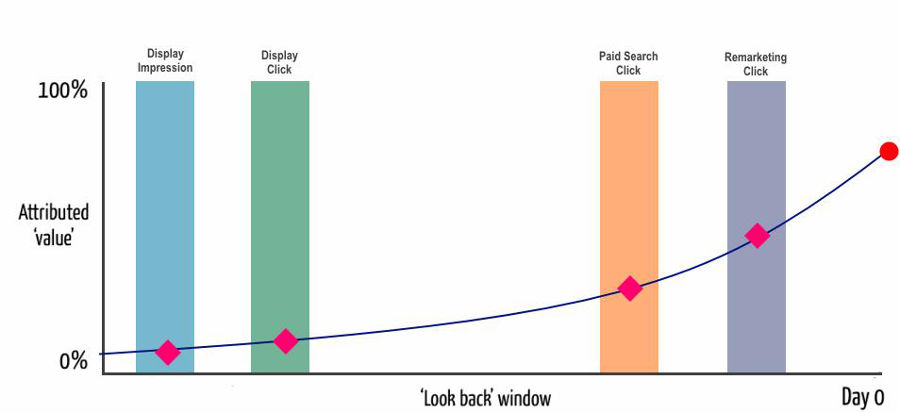
2. Note the Lookback Window
- this is the period of time after a customer clicks your ad that a conversion (e.g sale) will be recorded. The Lookback Window is set to 30 days. This means only Impressions and clicks within 30 days of the conversion are credited. The Lookback Window can be extended up to 90 days. Don’t extend the Lookback Window yet.
3. First we're working out how long it takes your customers to convert.
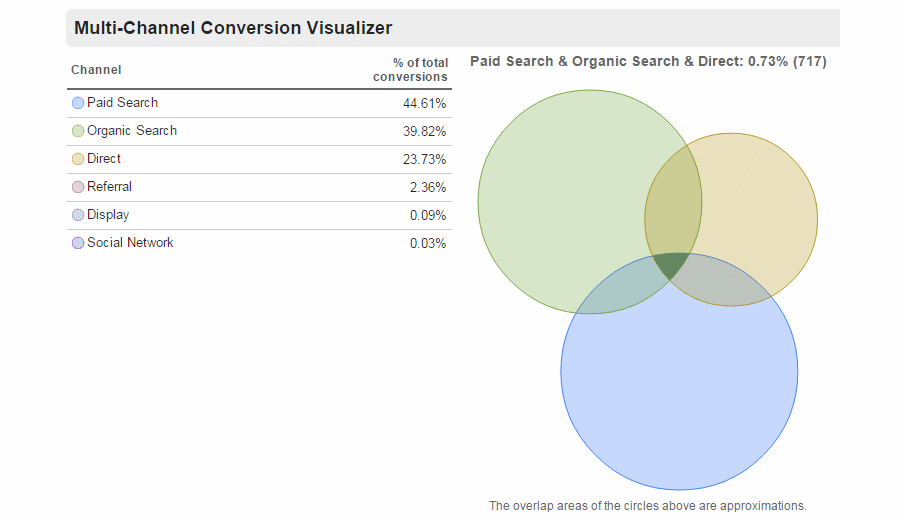
4. Check the Venn diagram in the Multi-Channel Funnels > Overview report.
- If there's a large overlap your customers use more than one Channel to visit the site.
5. Now check the Path Length report.
- A lot of conversions probably have more than one path length interaction.
- This means some of your Channels aren’t getting credit.
Which Channels Don’t Get Credit
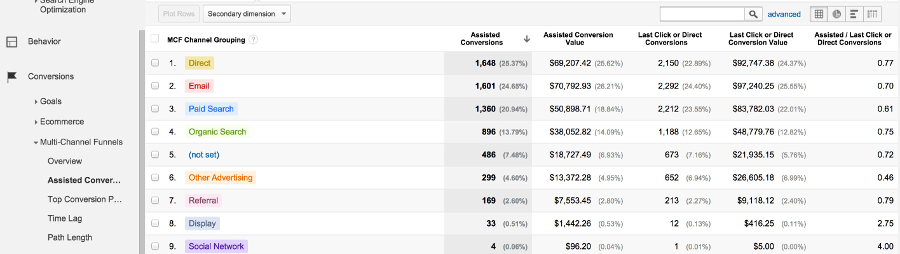
Open the Assisted Conversions report
Check the Assisted/Last Click or Direct Conversions value
- If the Channel ratio is close to 0, it drives last click conversions
- If the ratio is greater than 1, the Channel starts and assists lots of conversions. It probably isn’t getting any credit in your other reports.
- If the ratio is closer to 1, the Channel assists as many conversions as it completes
Assisted Conversions shows you how many conversion journeys the Channel was part of.
- If a Channel appears anywhere in the customer journey except the last click, it will be counted as an assisted conversion.
- If this number is high the Channel helps influence your customer.
- The Last Click or Direct Conversion value shows you how many sales the Channel closed.
- These Channels are the last click in the journey.
Change the metric group to First Interaction Analysis.
Find the First / Last Click or Direct Conversions ratio.
- If the ratio is closer to 0 the Channel tends to complete conversions.
- If the ratio is closer to 1 the Channel assists as many conversions as it completes.
- A ratio of more than 1 starts the conversions.
The First Click Conversion value is the total number of conversions the Channel started.
- These are the first touch points in a customer’s conversion path.
- The higher these numbers, the more important they are at starting the conversion funnel.
- Which Channels close most of your conversions?
- Which Channels assist the Last Click Channels?
- Which Channels start the conversion funnel?
Interaction Length
The time it takes to convert will vary depending on the products and services your advertising. A customer will take longer to consider an expensive purchase that requires more commitment.
1. Open the Time Lag Report
2. Set the Lookback Window to 90 days.
- Is this what you expected?
- How many conversions happen within a day of the customer’s first interaction with your ad?
3. If 75% of your conversions happen within 40 days try setting the Lookback Window to at least this length.
- If you don’t, you might miss some conversions started by your paid Channels.
- It's normal to see a drop in conversions a few days after the last interaction.
- Set up a remarketing audience in Google Analytics and target these customers with higher bids in AdWords.
- Change the Lookback Window based on the campaign you're analysing.
4. Which Channels take longer convert?
5. Do your customers research products before making a purchase?
6. Do you drive repeat customers?
The customer will also need to see your band and brand message a number of time before they convert.
- Open the Top Conversion Paths report
- Change the ‘Type’ of report to AdWords
- Change your Primary Dimension to ‘AdWords Keyword Path’.
You should be able to identify the keywords that start the conversion funnel.
- Open the Assisted Conversion Report
- Change the Primary Dimension to ‘AdWords Keyword’.
- Create a Conversion Segment to only view these keywords
- Use the Path length and Time Lag reports to see how long its takes your top funnel keywords to convert.
Now you can identify what keywords your customers use at the beginning of the conversion funnel (e.g. your upper funnel keywords).
- Alter the Lookback Window to see which Channels take longer to convert
- Which ones drive repeat business
- What your upper funnel keywords are
How Many Interactions To Make A Sale
Open the Path Length Report
- Q: How many of your conversion have more than one Path Length Interaction? - The number of different interactions (i.e. campaign views) a customer has with your ads or site before they convert.
If it takes a lot of interactions to convert a customer you can;
- Build campaigns that engages your customers
- Use remarketing, email and video to re-engage
- Increase ad frequency
- Use viewability reports to check your ads aren’t below the fold or being skipped
Links Between Channels, Ads, and Keywords
Open the Top Conversion Paths report
Change the Primary Dimension to ‘Keyword Path’
- This will show how keywords work with non-search Channels
Change the Primary Dimension to ‘Source/Medium Path’
1. Q: Do two Channels work well together and drive a lot of conversions?
- A: If they do, plan a coordinated campaign
- A; Increase the budgets in both Channels to capture a bigger audience.
2. Q: Do certain conversion funnels drive more conversions?
- A; Use that information to build a campaign that market across Channels.
Use the Time Lag and Top Conversion Paths report to plan campaign pacing.
1. If you can see which Channels starts the funnel, and it takes 15 days to convert, you should stagger the Channels.
2. The Channels that start conversions should begin before those that close the conversion.
Cost of Each Channel
You should have a much better idea of which Channels start, assist and close the conversion funnel. It’s also important to think about how much a sale costs. You can normally increase the number of conversions by spending more budget. However, it’s much harder to keep the cost of those extra conversions (e.g. incremental conversions) down.
Provided you’ve uploaded your cost data you can work out how much a conversion costs. We have worked out which Channels are normally early in the conversion funnel. These Channels start the customer journey so you might be tempted to increase the budget. But before you do, let’s check how much they cost.
Open Conversions tab
Attribution
1.Model Comparison Tool.
- The Model Comparison Tool will help you determine the most effective marketing Channels for investment.
2. Pick an attribution model that fits your business objectives.
- If your customers don’t spend a lot of time considering a purchase, use a Last Click attribution model.
- If your business objective is to increase the awareness of your brand you should use a First Interaction Model
3. Set your dates
4. Select the the conversion point
5. Extend the look back window to the correct length.
- Keep the settings consistent within a campaign. It's difficult to measure improvements if you're not consistent.
6. You should be able to clearly identify the traffic sources that drive the most conversions and which are the cheapest.
7. Use the Multi-Channel Funnel report to see which channels start the conversion funnel.
Although some channels (e.g. display here) might be at the beginning of the conversion funnel they might still have a high CPA. If they only drive a tiny proportion of conversions, they might not be worth investing in.
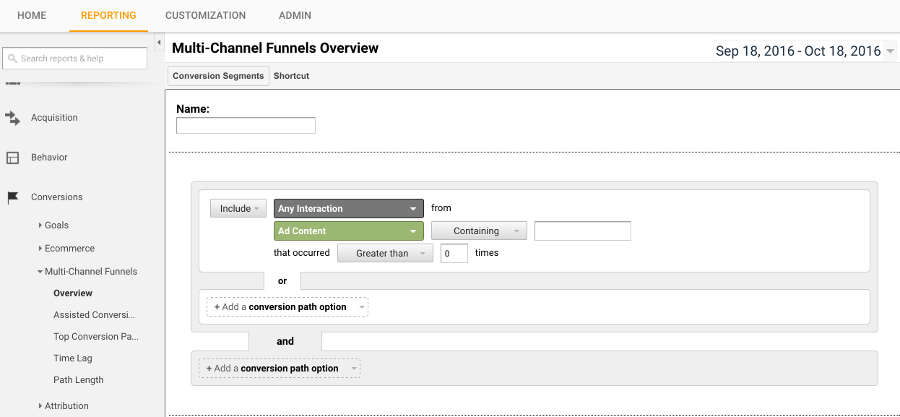
Segmenting Further
We are just scratching the surface. Now you understand what you’re doing, use the conversion segments to isolate specific conversion paths.
1. A conversion path that starts with paid search will probably have a shorter funnel than one that started with social.
2. The campaign messaging needed to convert a returning customer will be very different to that needed to convert a new customer.
3. The device type will have a huge impact on the ad creative.
Conclusion
1. You can now work out which channels and keywords start your conversion path.
- These probably aren’t getting credit and probably don’t get much budget.
2. How long it takes for customers to convert and better understand the conversion path.
3. How many times a customer has to interact with your messaging.
- Do you need to bid up on specific channels to get that messaging in front of them?
4. Finally how much a channels cost you for a sale or lead.
Round Up
If you need any help setting up your Google AdWords Account, give us a call or email us. We're always happy to help out where we can. As well as providing Google AdWords Consultancy we also offer Google AdWords Training.
Authored by Michael King

Tags:
Share:
If you found this helpfull, share it.
Related Blogs
Your online profile is your resume. Prospective clients will carefully review social media, blogs, industry reviews and peers reviews before contacting you. Old clients will b..
Take 15 minutes out of your day to tag all your digital marketing campaigns and ask your paid search agency to ensure Auto-Tagging is working...
I hate cold calling, and I hate cold emailing. I even find writing a blog difficult. I find writing with one person in mind makes it so much easier. I write to my perfect cus..